Tag Archives: Methodology

A Dissertation’s Infancy: The Geography of the Post

A history PhD can be thought of as a collection of overlapping areas: coursework, teaching, qualifying exams, and the dissertation itself. The first three are fairly structured. You have syllabi, reading lists, papers, classes, deadlines. The fourth? Not so much. Once you’re advanced to candidacy there’s a sense of finally being cut loose. Go forth, conquer the archive, and return triumphantly to pen a groundbreaking dissertation. It’s exhilarating, empowering, and also terrifying as hell. I’ve been swimming through the initial research stage of the dissertation for the past several months and thought it would be a good time to articulate what, exactly, I’m trying to find. Note: if you are less interested in American history and more interested in maps and visualizations, I would skip to the end.

The Elevator Speech

I’m studying communications networks in the late nineteenth-century American West by mapping the geography of the U.S. postal system.*

The Elevator-Stuck-Between-Floors Speech

From the end of the Civil War until the end of the nineteenth century the US. Post steadily expanded into a vast communications network that spanned the continent. By the turn of the century the department was one of the largest organizational units in the world. More than 200,000 postmasters, clerks, and carriers were involved in shuttling billions of pounds of material between 75,000 offices at the cost of more than $100 million dollars a year. As a spatial network the post followed a particular geography. And nowhere was this more apparent than in the West, where the region’s miners, ranchers, settlers, and farmers led their lives on the network’s periphery. My dissertation aims to uncover the geography of the post on its western periphery: where it spread, how it operated, and its role in shaping the space and place of the region.

My project rests on the interplay between center and periphery. The postal network hinged on the relationship between its bureaucratic center in Washington, DC and the thousands of communities that constituted the nodes of that network. In the case of the West, this relationship was a contentious one. Departmental bureaucrats found themselves buffeted with demands to reign in ballooning deficits. Yet they were also required by law to provide service to every corner of the country, no matter how expensive. And few regions were costlier than the West, where a sparsely settled population scattered across a huge area was constantly rearranged by the boom-and-bust cycles of the late nineteenth century. From the top-down perspective of the network’s center, providing service in the West was a major headache. From the bottom-up perspective of westerners the post was one of the bedrocks of society. For most, it was the only affordable and accessible form of long-distance communication. In a region marked by transience and instability, local post offices were the main conduits for contact with the wider world. Western communities loudly petitioned their Congressmen and the department for more offices, better post roads, and speedier service. In doing so, they redefined the shape and contours of both the network and the wider geography of the region.

The post offers an important entry point into some of the major forces shaping American society in the late nineteenth century. First, it helped define the role of the federal government. On a day-to-day basis, for many Americans the post was the federal government. Articulating the geographic size and scale of the postal system will offer a corrective to persistent caricatures of the nineteenth-century federal government as weak and decentralized. More specifically, a generation of “New Western” historians have articulated the omnipresent role of the state in the West. Analyzing the relationship between center and periphery through the post’s geography provides a means of mapping the reach of federal power in the region. With the postal system as a proxy for state presence, I can begin to answer questions such as: where and how quickly did the state penetrate the West? How closely did it follow on the heels of settler migration, railroad development, or mining industries? Finally, the post was deeply enmeshed in a system of political patronage, with postmasterships disbursed as spoils of office. What was the relationship between a communications network and the geography of regional and national politics?

Second, the post rested on an often contentious marriage between the public and private spheres. Western agrarian groups upheld the post as a model public monopoly. Nevertheless, private hands guided the system’s day-to-day operations on its periphery. Payments to mail-carrying railroad companies became the department’s single largest expenditure, and it doled out millions of dollars each year to private contractors to carry the mail in rural areas. This private/public marriage came with costs – in the early 1880s, for instance, the department was rocked by corruption scandals when it discovered that rural private contractors had paid kickbacks to department officials in exchange for lavish carrying contracts. How did this uneasy alliance of public and private alter the geography of the network? And how did the department’s need to extend service in the rural West reframe wider debates over monopoly, competition, and the nation’s political economy?

Getting Off The History Elevator

That’s the idea, at least. Rather than delve into even greater detail on historiography or sources, I’ll skip to a topic probably more relevant for readers who aren’t U.S. historians: methodology. Digital tools will be the primary way in which I explore the themes outlined above. Most obviously, I’m going to map the postal network. This entails creating a spatial database of post offices, routes, and timetables. Unsurprisingly, that process will be incredibly labor intensive: scanning and georeferencing postal route maps, or transcribing handwritten microfilmed records into a database of thousands of geocoded offices. But once I’ve constructed the database, there are any number of ways to interrogate it.

To demonstrate, I’ll start with lower-hanging fruit. The Postmaster General issues an annual report providing (among other information) data on how many offices were established and discontinued in each state. These numbers are fairly straightforward to put into a table and throw onto a map. Doing so provides a top-down view of the system from the perspective of a bureaucrat in Washington, D.C. For instance, by looking at the number of post offices discontinued each year it’s possible to see the wrenching reverberations of the Civil War as the postal system struggled to reintegrate southern states into its network in 1867:
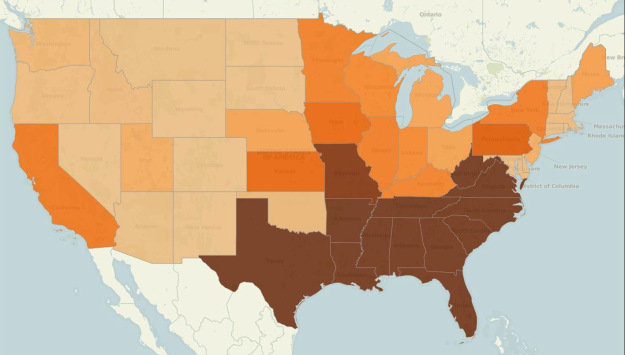
Post Offices Discontinued By State, 1867
(Source: Annual Report of the Postmaster General, 1867)

The West, meanwhile, was arguably the system’s most unstable region. As measured by the percentage of its total offices that were either established or discontinued each year, states such as New Mexico, Colorado, and Montana were continually building and dismantling new nodes in the network.
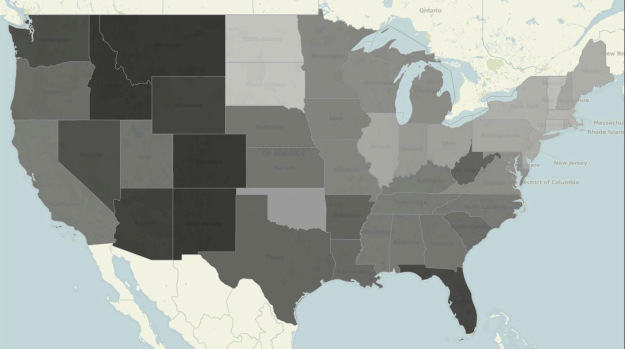
Post Offices Established or Discontinued as a Percentage of Total Post Offices in State, 1882
(Source: Annual Report of the Postmaster General, 1882)

Of course, the broad brush strokes of national, year-by-year data only provide a generalized snapshot of the system. I plan on drilling down to far more detail  by charting where and when specific post offices were established and discontinued. This will provide a much more fine-grained (both spatially and temporally) view of how the system evolved. Geographer Derek Watkins has employed exactly this approach:
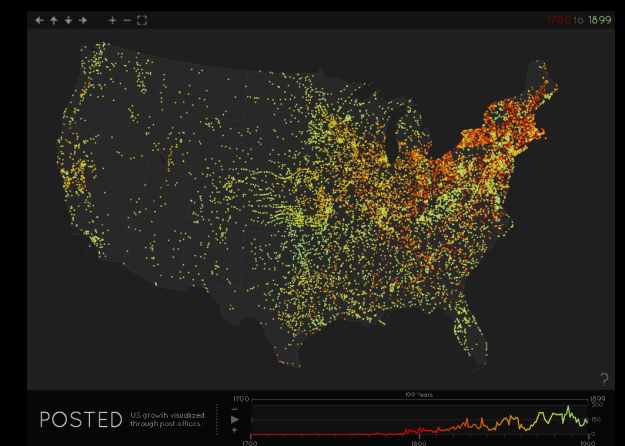
Screenshot from Derek Watkins, “Posted: U.S. Growth Visualized Through Post Offices” (25 September 2011)

Derek’s map demonstrates the power of data visualization: it is compelling, interactive, and conveys an enormous amount of information far more effectively than text alone. Unfortunately, it also relies on an incomplete dataset. Derek scraped the USPS Postmaster Finder, which the USPS built as a tool for genealogists to look up postmaster ancestors. The USPS historian adds to it on an ad-hoc basis depending on specific requests by genealogists. In a conversation with me, she estimated that it encompasses only 10-15% of post offices, and there is no record of what has been completed and what remains to be done. Derek has, however, created a robust data visualization infrastructure. In a wonderful demonstration of generosity, he has sent me the code behind the visualization. Rather than spending hours duplicating Derek’s design work, I’ll be able to plug my own, more complete, post office data into a beautiful existing interface.

Derek’s generosity brings me back to my ongoing personal commitment to scholarly sharing. I plan on making the dissertation process as open as possible from start to finish. Specifically, the data and information I collect has broad potential for applications beyond my own project. As the backbone of the nation’s communications infrastructure, the postal system provides rich geographic context for any number of other historical inquiries. Cameron Ormsby, a researcher in Stanford’s Spatial History Lab, has already used post office data I collected as a proxy for measuring community development in order to analyze the impact of land speculation and railroad construction in Fresno and Tulare counties.

To kick things off, I’ve posted the state-level data I referenced above on my website as a series of CSV files. I also used Tableau Public to generate a quick-and-dirty way for people to interact with and explore the data in map form. This is an initial step in sharing data and I hope to refine the process as I go. Similarly, I plan on occasionally blogging about the project as it develops. Rather than narrowly focusing on the history of the U.S. Post, my goal (at least for now) is to use my topic as a launchpad to write about broader themes: research and writing advice, discussions of digital methodology, or data and visualization releases.

*By far the most common response I’ve received so far: “Like the Pony Express?” Interestingly, the Pony Express was a temporary experiment that only existed for about eighteen months in 1860-1861. In terms of mail carried, cost, and time in existence, it was a tiny blip within the postal department’s operations. Yet it has come to occupy a lofty position in America’s historical memory and encapsulates a remarkable number of the contradictions and mythologies of the West.

Methodologies and the (Digital) History Major

Stanley N. Katz and James Grossman recently led a working group backed by the National History Center and the Teagle Foundation, and drafted a thought-provoking report titled, The History Major and Undergraduate Liberal Education. The paper got some decent play on the history and education blogosphere, and with good reason. It brought up a variety of interesting issues, but chief among, from my perspective, is one of methodology.

In the report, Katz and Grossman point out that the history academy tends to be moving away from traditional methodological categories – “political history, economic history, social history, intellectual history” – and towards categories of people and places. I would tend to agree, although the line between these two methodological approaches tends to be rather blurry and fluid (and I’m guessing the authors would not imply a distinctive break between them). It makes me wonder – are historians truly engaging in a large-scale shift in methodologies? Or is the academy coming up with new phrases to describe pre-existing approaches? A work such as Erskine Clark’s Dwelling Place: A Plantation Epic, could be read as a traditional work of “social history,” or it could be read as (obviously) African-American history, family history, rural history, or some combination of all three. Do “traditional” methodologies simply imply broader, umbrella categories?

Instead, I would argue (with freely admitted bias) that an equally important shift will take, and is currently taking, place within the academy: the transformation of analog to digital scholarship on a methodological level. Tom Scheinfeldt wrote a particularly incisive blog post on this topic provocatively titled, “Sunset for Ideology, Sunrise for Methodology?”: “I believe we are at a similar moment of change right now, that we are entering a new phase of scholarship that will be dominated not by ideas, but once again by organizing activities, both in terms of organizing knowledge and organizing ourselves and our work.”

Unfortunately, many in the academic blogosphere took the post as an attack on the validity of cherished theoretical “-isms” in the field. Too much focus rested on this aspect of the post, which Tom admitted in its comments was not the aim or intention. Instead, what gets lost is the bold assertion that the next big change in historical scholarship will come from the nuts-and-bolts of how we “do” history.

Katz and Grossman touch upon this change: “Liberal learning in the twenty-first century must include an emphasis on information sifting, the ability to work through massive quantities of data and references to identify what is useful and reliable.” While they offer a few other references to this new paradigm, they don’t spell out exactly how the skills of a history major relate to a liberal education in a specifically digital context (this is not the point of their paper).

I’d like to look at Katz and Grossman’s conclusions through a digital lens, and spell out specifically how I believe some of their observations and suggestions can be specifically linked to Tom’s “sunrise of methodology”:

- “History is thus inherently (though not necessarily for any individual historian) a multidisciplinary field and one in which inquiry begins with the problem and the historical context, not the discipline or dominant theory.”

Digital historians are necessarily engaging in interdisciplinary (or multidisciplinary) studies, as they not only need to know technical skills (programming, statistics, GIS, etc.) but also the broader issues prevalent in these fields. When creating maps for my history thesis in GIS, I not only had to learn how to import shapefiles, but also the background of coordinate projections, issues with small-scale vs. large-scale mapping, and basic tenets of cartographic design and layout. When utilizing a wide range of tools and techniques, a digital humanist is forced to learn not only “hard” skills, but their accompanying “soft” skills as well.

- “History places a premium on the capacity of synthesis.”

I couldn’t agree more. I feel that this will truly be one of the distinct advantages a history major might have over other scholars: the ability to efficiently and effectively sift through mountains of source material in order to extract content, recognize broader patterns, and evaluate their metadata (both traditional and digital). These skills form the basis of historical inquiry, and as our collections of digitized sources grow ever larger the proper utilization of these skills will be placed at a higher and higher premium, especially when paired with new media tools and techniques.

- “The single most important contribution that training in history can make to the liberal learning of undergraduates is to help students to contextualize knowledge, offering an antidote to naive presentism.”

One hallmark of the digital age is the ephemeral nature of information. Lacking the inherent stability and traditional gatekeeping of the analog era, it becomes more and more difficult to “pin down” knowledge. Without assurance that a website will exist tomorrow or next week or next year, knowledge and authority become much more fluid, and users will be even more inclinated towards presentism (whether naive or not). Historians will need to offer their skills in contextualizing and framing a constantly shifting corpus of information, at the very least in order to provide a sense of temporal perspective.

-”We need to be more thoughtful in locating history in relation to other disciplines, and in relating to the ‘historical turn’ in other humanities and social science disciplines.”

History has a lot to learn from other disciplines, and vice-versa. Just as digital humanists use a multidisciplinary toolbox, their utilization of these tools also tends to blur the traditional lines between disciplines. When a historian engages in complex statistical analysis using computer software to examine tax records, where does the line fall between economics and history? There needs to be a dialogue about how to most effectively employ and engage history within these other disciplines. In industry terms, the academy needs to figure out a “value-add” system of mutual benefit. And one key to this process (which Katz and Grossman describe) is that of cross-departmental collaboration, both in research and in teaching.

All in all, this is an excellent report that brings into focus far more important issues than I touched upon here. I would highly recommend it to anyone with an active interest in the current state and possible future of the field.

Review: Placing History (III)

(This is the third installment of my review of Placing History. See the first and the second parts.)

I’ve finally finished Placing History: How Maps, Spatial Data, and GIS are Changing Historical Scholarship. As my previous posts have made clear, I’m quite impressed with the breadth and depth of the compilation. As before, I’ll briefly recount the remaining chapters, and wrap up my thoughts at the end.

“Mapping Husbandry in Concord: GIS as a Tool for Environmental History,” by Brian Donahue. I liked this chapters for a multitude of reasons. On a personal note, his research is quite similar (though wider in scale) to the work I did in mapping property holdings and transactions of Venture Smith. So in a self-congratulatory mood, I found myself nodding with satisfied agreement at his various points about the benefits and drawbacks to mapping land deeds and parcels. On a less personal level, I liked the various angles he took in pursuing his study of Concord – especially examining seemingly disparate holdings of a variety of original families and noting patterns of land use.

“Combining Space and Time: New Potential for Temporal GIS,” by Michael Goodchild. For starters, the cover illustration for this chapter was a piece of Charles Minard’s famous “Carte Figurative,” which depicts a staggering array of geographic, temporal, and statistical information regarding Napoleon’s ill-fated Russian campaign:

Charles Minard

Charles Minard's "Carte Figurative"

Information graphic guru Edward Tufte described it as “the best statistical graphic ever drawn,” which effectively canonized it for any map and information graphic nerd such as myself. This is a roundabout way of saying I was excited to start reading Goodchild’s chapter. Goodchild doesn’t dissapoint, as he uses decades of geography experience to explore ways in which the field is gradually shifting to incorporate temporal data. Although its heavy on technical geography, it’s a rewarding chapter that covers one of the fundamental challenges of historical GIS: how do you visually display the relationship between space and time? Goodchild predicts that this challenge will rapidly diminish, as tools and systems to display things such as dynamic data, or even a history-specific model, will become more and more accessible and widespread.

“New Windows on the Peutinger Map of the Roman World,” by Richard J.A. Talbert and Tom Elliot. Talbert and Elliott present an analysis of the Peutinger Map, a nearly 7 meter long Roman map depicting the Mediterranean world and beyond, constructed around 300 CE:

Detail of Peutinger's Map

Detail of Peutinger's Map

I liked this chapter a lot, despite my complete unfamiliarity with the subject matter. The authors make compelling arguments backed by GIS analysis, such as: “the basis of the map’s design was not its network of land routes (as has always been assumed) but rather the shorelines and principal rivers and mountain ranges, together with the major settlements marked by pictorial symbols.” They present a quantitative analysis of routes, and utilize a histogram to further examine the segments and their distances.

“History and GIS: Implications for the Discipline,” by David J. Bodenhamer. This chapter, along with the first chapter and conclusion, gives the best “big-picture” perspective on historical GIS. Bodenhamer describes the field of history as a whole, in particular elements of it that relate to spatial analysis. He believes that in order for GIS to become a valuable historical tool, “it must do so within the norms embraced by historians…” GIS is well-situated to do so, because it uses a format of presenting information (the map) that historians are already familiar with, and its visualization and integration of information makes it easier to display the complexity of historical interpretation. He also discusses the challenges to historical GIS. One point I really liked was that technology as a whole, and GIS in particular, often requires a level of precision that historical documents cannot display within “a technology that requires polygons to be closed and points to be fixed by geographical coordinates.” Other challenges range from the theoretical (ex. temporal analysis) to the practical (ex. learning a completely new discipline). Finally, he succinctly sums up one of the greatest challenges: “GIS does not strike many historians as a useful technology because we are not asking questions that allow us to use it profitably.” I could not have said it better myself – until historians begin to ask the type of questions that can be addressed through spatial analysis, GIS will likely remain a technological oddity within the discipline.

“What Could Lee See At Gettysburg?” Anne Kelly Knowles. This is probably one of the most accessible chapters in the book for a layperson. It combines an engaging narrative prose with rich, stylistic maps, and a “popular” subject matter (the Battle of Gettysburg). But more importantly, it clearly presents an answer to a historical question, while contextualizing the issue and presenting possible ideas for future studies. Viewshed (line-of-sight) analysis is of obvious and particular interest to military historians, but it has other implications as well. In particular, this chapter illustrates the phenomenal power of GIS to transport the reader to the past, and get a micro sense of “being” there.

Beyond thoroughly enjoying Placing History, I believe it’s an important contribution to the field of historical methodology in general, and (of course) historical GIS in particular. The compilation gives a wonderful balance while thoroughly exploring the topic: its current state and background, case studies ranging from micro to macro and “hard” to “soft”, discussions on theory and approach, and an outline for the future. I recommend the book to educators, historians, digital humanists, or anyone with even a passing interest in a growing and valuable area of scholarship.

Review: Placing History (II)

(This is the second installment of my review of Placing History. See the first and the third parts)

I’ve just finished reading about half of Placing History: How Maps, Spatial Data, and GIS are Changing Historical Scholarship, edited by Anne Kelly Knowles. I’ll briefly go through each one, and focus on the ones that particularly interested me.

“Creating a GIS for the History of China,” by Peter K. Bol. Bol, chair of Harvard’s Department of East Asian Languages and Civilizations, discusses his China Historical GIS project. The project attempts to create a basic framework and data source (both spatial and temporal) for geospatial analysis of Chinese history. On a theoretical note, Bol argues that in the case of China, historical GIS should utilize a greater reliance on point data in place of polygons for marking boundaries and territory, in order to better replicate the top-down administrative system of traditional Chinese cartography.

“Teaching With GIS,” by the late Robert Churchill and Amy Hillier. Churchill gives a good overview of the value of GIS in a liberal arts education. I liked his point that one of the benefits of using historical GIS is that any in-depth use of the technology requires an equally in-depth understanding of the problem you’re looking to address. Great point. Because so much of GIS is front-loaded, in that you spend a huge amount of effort in obtaining and managing the data, it requires you to really get your hands dirty in the sources themselves. Hillier gives a lot of great examples of students’ work using historical GIS, mostly Philadelphia-based data. Some of them also included a great 1896 map by W.E.B. Du Bois detailing social class in the city. She also gives some useful tips for educators who want to incorporate GIS.

“Scaling the Dust Bowl,” by Geoff Cunfer. I loved this chapter. Cunfer follows up his previous research in Knowles first book, Past Time, Past Place, by additional analysis of the Dust Bowl. In this chapter, he takes on the common perception of the dust bowl as championed by Donald Worster’s Dust Bowl: The Southern Plains in the 1930′s. While some of Cunfer’s analysis supports Worster, he takes issue with Worster’s commonly-held assertion that the capitalistic over-development of lands for farming the major factor in the fabled 1930′s dust storms. Cunfer first demonstrates through spatial analysis that, although plow-up during the 1920′s did contribute to the Dust Bowl, it was in fact instances of drought that had a much more direct correlation.

He goes on to further his critique of the notion that the Dust Bowl was an extraordinary phenomena caused by human activity. By examining and mapping newspaper accounts of dust storms from the 19th century, along with storms after the 1930′s, he finds that “dust storms are a normal part of southern plains ecology, occurring whenever there are extended dry periods.” Although extensive plowing can enhance the problem, it was not “the sole and simple cause of the Dust Bowl.” Cunfer’s analysis succeeds on many different levels. First, I like the accessibility of it. There’s always a temptation to include too much in the final products, to show off the fruits of your hours and hours of labor. Instead, his maps are clear, uncluttered, and persuasive.  Second, I like the way he blended traditionally quantitative analysis tools (GIS) with qualitative historical research (newspaper accounts). He does a good job of highlighting this tension, and aptly warns of its danger, while explaining simply how he accomplished it. Third, his work is a great example of the “right way” to use new technology to both challenge and supplement traditional historical arguments, and in doing so, present an original and different narrative.

“‘A Map is Just a Bad Graph’: Why Spatial Statistics are Important in Historical GIS,” by Ian Gregory. This chapter was much more technical, and included scary words like “regression coefficients” and “heteroscedasticity.” Although statistics in particular, and math in general, is low down on my list of skills, I got a fair amount out of the chapter. I liked his critique of the traditional thematic map, which usually displays one type of data, and with usually one variable involved. Statistical analysis can go beyond simple thematic maps and really open up the powerful underbelly of GIS.

There are several more chapters that I am looking forward to reading and reviewing in a later post.

Review: Placing History (I)

(This is the first installment of my review of Placing History. See the second and the third parts.)

I finally got around to sitting down with Placing History: How Maps, Spatial Data, and GIS are Changing Historical Scholarship, edited by Anne Kelly Knowles. The book addresses the growing field of combining Geographic Information System (GIS) software with historical scholarship. ((Technical aside: GIS is a broad term for digital analysis of geographic information – most commonly used for making maps – that allows users to input, store, and analyze a huge range of spatial data in a mind-boggling number of ways. Personal aside: I have a been using GIS software for about two years – I employed it extensively in my undergrad research and took a geology class constructed almost entirely around ArcGIS analysis.)) Broken into chapters comprised of individual studies conducted by a variety of scholars, it’s the more modern version of Knowles’s 2002 volume, Past Time, Past Place: GIS for History. The chapters of Placing History range from the quantitatively analytical “Scaling the Dust Bowl” and “Mapping Husbandry in Concord: GIS as a Tool for Environmental History,” to the more big-picture, theory-based “Combining Space and Time: New Potential for Temporal GIS.”

Originally I was planning on finishing all of the chapters before I posted a review of the volume as a whole, but I was too blown away by the introductory chapter of the book, “GIS and History,” written by Knowles. She gives both a wide-ranging and deep analysis of the field. Knowles begins the chapter with the optimistic assertion that, “scholars’ use of geographic information systems (GIS) is changing the practice of history.” From there she gives a brief history of the field, then delves into its current state. I think her greatest accomplishment in this chapter is to balance the obstacles to historical GIS with its huge potential for innovation and scholarship.

On the obstacle end, she writes that one major impediment to historical GIS is the fundamental divide of time vs. space – history is largely a study of subjects within a temporal framework, whereas GIS works largely within a spatial one. And she admits that, “For all practical purposes, historical GIS remains an ad hoc subfield that scholars discover serendipitously.” One reason may be a common complaint of historians concerning geography: that maps are too often seen as stand-alone, objective vessels of information. Instead, Knowles brings up the great point that any serious use of historical GIS requires rigorous examination and discovery of spatial source material, as much as any historian would need to employ in utilizing any diary, letter, or tax record for their research.

Nevertheless, Knowles does a great job of clearly outlining both the advances that have been made and the possibilities for the future. I agree with her basic outlines of the three types of historical GIS currently used:

1. History of land use and spatial economy, ex. outlining agricultural shifts in response to economic or environmental changes.

2. Reconstructing past landscapes, ex. analyzing Robert E. Lee’s line-of-sight (what he could see) during the Battle of Gettysburg.

3. Infrastructure projects, ex. scientists compiling historical landuse datasets in order to track global warming.

In actuality, though, it is nearly impossible to generalize the range of possibilities for historical GIS. The major constraint is really one of imagination and resources – are people aware of all its possibilities, and do they have access to the software/expertise. Finally, she struck a real personal chord in me with her observation that “The most exciting thing about historical GIS is often the ‘eureka’ moment when someone sees data mapped for the first time.” Much like discovering a long-sought after name or date or reference within a manuscript or microfilm, suddenly witnessing your hard work take a physical, visible shape on a computer screen is truly special.

I’m looking forward to reading the rest of the case studies and writing up a brief review, but for a superb introduction to the field of historical GIS, I couldn’t ask for anything better than what Knowles has produced in the opening chapter. At some point I would like to write a post solely dedicated to brainstorming ideas about the ways GIS could be utilized for history in particular and the humanities as a whole, in the vein of PhDinHistory’s blog post, “What I Would Like To See in Text Mining For Historians.”