Tag Archives: Maps

Map of Early Modern London

I’m glad to see the Map of Early Modern London is getting a fair amount of coverage. Spearheaded by Janelle Jenstad at the University of Victoria, the project “maps the streets, sites, and significant boundaries of late sixteenth-century and early seventeenth-century London. You will see many of the theatres and landmarks of Shakespeare’s time, and learn about the history and culture of the city in which he lived and worked.” In order to do so, they have created two interfaces of the Agas map of London. One is an old-school format of breaking the map into a basic grid with 32 boxes – clicking on one zooms in to that section and shows starred points of interest, such as taverns, theaters, etc. Hovering your mouse over the star gives you the name, and clicking on it takes you to more information about the location. This format is okay, but limited. For someone who has become completely accustomed to GoogleMaps, it is frustrating not having the quick and easy control of zooming in and out, panning, or finding information while remaining “in” the map.

They attempted to address this with an experimental map, which has a much more complex and interactive interface:

This really puts you in the driver’s seat in determining how you want it to appear, maneuvering through the map, and accessing its information. Jenstad designed the project as a pedagogical tool, and I think it would work really well for the classroom. It allows students to find information while also exploring the city and being able to observe geographical patterns or relationships. Interesting assignments could be looking for patterns in establishments, comparing and contrasting different wards and their contents, or designing a “walking tour” based on a theme of their choosing. I wish they would also make it possible to create a mash-up that incorporates present-day multimedia, such as clicking on a location and having a photograph or video appear.

The site does have its share of bugs and problems – broken links, buttons that disappear or don’t do anything, etc. Maneuvering within the map (even the experimental one) still feels kind of clunky. This is a general problem with interactive maps that aren’t based off an already-existing structure (such as GoogleMaps, ArcMap, etc.) Independently created maps can often seem amateur in comparison to standard, powerful formats we are used to utilizing. Nevertheless, I admire the project and the way it was carried out. It is immensely collaborative, with a long list of student contributors, and general guidelines for contributing information and plans to create an editorial board that will use a “refereeing process” of evaluation.

Review: Placing History (III)

(This is the third installment of my review of Placing History. See the first and the second parts.)

I’ve finally finished Placing History: How Maps, Spatial Data, and GIS are Changing Historical Scholarship. As my previous posts have made clear, I’m quite impressed with the breadth and depth of the compilation. As before, I’ll briefly recount the remaining chapters, and wrap up my thoughts at the end.

“Mapping Husbandry in Concord: GIS as a Tool for Environmental History,” by Brian Donahue. I liked this chapters for a multitude of reasons. On a personal note, his research is quite similar (though wider in scale) to the work I did in mapping property holdings and transactions of Venture Smith. So in a self-congratulatory mood, I found myself nodding with satisfied agreement at his various points about the benefits and drawbacks to mapping land deeds and parcels. On a less personal level, I liked the various angles he took in pursuing his study of Concord – especially examining seemingly disparate holdings of a variety of original families and noting patterns of land use.

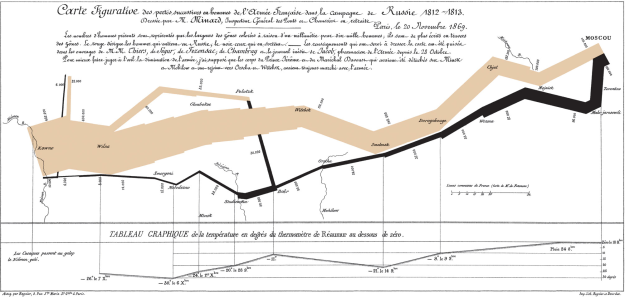
“Combining Space and Time: New Potential for Temporal GIS,” by Michael Goodchild. For starters, the cover illustration for this chapter was a piece of Charles Minard’s famous “Carte Figurative,” which depicts a staggering array of geographic, temporal, and statistical information regarding Napoleon’s ill-fated Russian campaign:
Charles Minard

Charles Minard's "Carte Figurative"

Information graphic guru Edward Tufte described it as “the best statistical graphic ever drawn,” which effectively canonized it for any map and information graphic nerd such as myself. This is a roundabout way of saying I was excited to start reading Goodchild’s chapter. Goodchild doesn’t dissapoint, as he uses decades of geography experience to explore ways in which the field is gradually shifting to incorporate temporal data. Although its heavy on technical geography, it’s a rewarding chapter that covers one of the fundamental challenges of historical GIS: how do you visually display the relationship between space and time? Goodchild predicts that this challenge will rapidly diminish, as tools and systems to display things such as dynamic data, or even a history-specific model, will become more and more accessible and widespread.

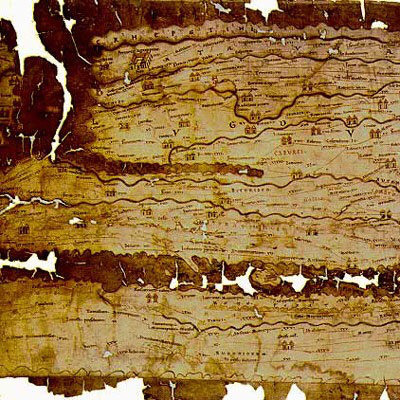
“New Windows on the Peutinger Map of the Roman World,” by Richard J.A. Talbert and Tom Elliot. Talbert and Elliott present an analysis of the Peutinger Map, a nearly 7 meter long Roman map depicting the Mediterranean world and beyond, constructed around 300 CE:
Detail of Peutinger's Map

Detail of Peutinger's Map

I liked this chapter a lot, despite my complete unfamiliarity with the subject matter. The authors make compelling arguments backed by GIS analysis, such as: “the basis of the map’s design was not its network of land routes (as has always been assumed) but rather the shorelines and principal rivers and mountain ranges, together with the major settlements marked by pictorial symbols.” They present a quantitative analysis of routes, and utilize a histogram to further examine the segments and their distances.

“History and GIS: Implications for the Discipline,” by David J. Bodenhamer. This chapter, along with the first chapter and conclusion, gives the best “big-picture” perspective on historical GIS. Bodenhamer describes the field of history as a whole, in particular elements of it that relate to spatial analysis. He believes that in order for GIS to become a valuable historical tool, “it must do so within the norms embraced by historians…” GIS is well-situated to do so, because it uses a format of presenting information (the map) that historians are already familiar with, and its visualization and integration of information makes it easier to display the complexity of historical interpretation. He also discusses the challenges to historical GIS. One point I really liked was that technology as a whole, and GIS in particular, often requires a level of precision that historical documents cannot display within “a technology that requires polygons to be closed and points to be fixed by geographical coordinates.” Other challenges range from the theoretical (ex. temporal analysis) to the practical (ex. learning a completely new discipline). Finally, he succinctly sums up one of the greatest challenges: “GIS does not strike many historians as a useful technology because we are not asking questions that allow us to use it profitably.” I could not have said it better myself – until historians begin to ask the type of questions that can be addressed through spatial analysis, GIS will likely remain a technological oddity within the discipline.

“What Could Lee See At Gettysburg?” Anne Kelly Knowles. This is probably one of the most accessible chapters in the book for a layperson. It combines an engaging narrative prose with rich, stylistic maps, and a “popular” subject matter (the Battle of Gettysburg). But more importantly, it clearly presents an answer to a historical question, while contextualizing the issue and presenting possible ideas for future studies. Viewshed (line-of-sight) analysis is of obvious and particular interest to military historians, but it has other implications as well. In particular, this chapter illustrates the phenomenal power of GIS to transport the reader to the past, and get a micro sense of “being” there.

Beyond thoroughly enjoying Placing History, I believe it’s an important contribution to the field of historical methodology in general, and (of course) historical GIS in particular. The compilation gives a wonderful balance while thoroughly exploring the topic: its current state and background, case studies ranging from micro to macro and “hard” to “soft”, discussions on theory and approach, and an outline for the future. I recommend the book to educators, historians, digital humanists, or anyone with even a passing interest in a growing and valuable area of scholarship.

Review: Placing History (II)

(This is the second installment of my review of Placing History. See the first and the third parts)

I’ve just finished reading about half of Placing History: How Maps, Spatial Data, and GIS are Changing Historical Scholarship, edited by Anne Kelly Knowles. I’ll briefly go through each one, and focus on the ones that particularly interested me.

“Creating a GIS for the History of China,” by Peter K. Bol. Bol, chair of Harvard’s Department of East Asian Languages and Civilizations, discusses his China Historical GIS project. The project attempts to create a basic framework and data source (both spatial and temporal) for geospatial analysis of Chinese history. On a theoretical note, Bol argues that in the case of China, historical GIS should utilize a greater reliance on point data in place of polygons for marking boundaries and territory, in order to better replicate the top-down administrative system of traditional Chinese cartography.

“Teaching With GIS,” by the late Robert Churchill and Amy Hillier. Churchill gives a good overview of the value of GIS in a liberal arts education. I liked his point that one of the benefits of using historical GIS is that any in-depth use of the technology requires an equally in-depth understanding of the problem you’re looking to address. Great point. Because so much of GIS is front-loaded, in that you spend a huge amount of effort in obtaining and managing the data, it requires you to really get your hands dirty in the sources themselves. Hillier gives a lot of great examples of students’ work using historical GIS, mostly Philadelphia-based data. Some of them also included a great 1896 map by W.E.B. Du Bois detailing social class in the city. She also gives some useful tips for educators who want to incorporate GIS.

“Scaling the Dust Bowl,” by Geoff Cunfer. I loved this chapter. Cunfer follows up his previous research in Knowles first book, Past Time, Past Place, by additional analysis of the Dust Bowl. In this chapter, he takes on the common perception of the dust bowl as championed by Donald Worster’s Dust Bowl: The Southern Plains in the 1930’s. While some of Cunfer’s analysis supports Worster, he takes issue with Worster’s commonly-held assertion that the capitalistic over-development of lands for farming the major factor in the fabled 1930’s dust storms. Cunfer first demonstrates through spatial analysis that, although plow-up during the 1920’s did contribute to the Dust Bowl, it was in fact instances of drought that had a much more direct correlation.

He goes on to further his critique of the notion that the Dust Bowl was an extraordinary phenomena caused by human activity. By examining and mapping newspaper accounts of dust storms from the 19th century, along with storms after the 1930’s, he finds that “dust storms are a normal part of southern plains ecology, occurring whenever there are extended dry periods.” Although extensive plowing can enhance the problem, it was not “the sole and simple cause of the Dust Bowl.” Cunfer’s analysis succeeds on many different levels. First, I like the accessibility of it. There’s always a temptation to include too much in the final products, to show off the fruits of your hours and hours of labor. Instead, his maps are clear, uncluttered, and persuasive.  Second, I like the way he blended traditionally quantitative analysis tools (GIS) with qualitative historical research (newspaper accounts). He does a good job of highlighting this tension, and aptly warns of its danger, while explaining simply how he accomplished it. Third, his work is a great example of the “right way” to use new technology to both challenge and supplement traditional historical arguments, and in doing so, present an original and different narrative.

“‘A Map is Just a Bad Graph': Why Spatial Statistics are Important in Historical GIS,” by Ian Gregory. This chapter was much more technical, and included scary words like “regression coefficients” and “heteroscedasticity.” Although statistics in particular, and math in general, is low down on my list of skills, I got a fair amount out of the chapter. I liked his critique of the traditional thematic map, which usually displays one type of data, and with usually one variable involved. Statistical analysis can go beyond simple thematic maps and really open up the powerful underbelly of GIS.

There are several more chapters that I am looking forward to reading and reviewing in a later post.

Review: Placing History (I)

(This is the first installment of my review of Placing History. See the second and the third parts.)

I finally got around to sitting down with Placing History: How Maps, Spatial Data, and GIS are Changing Historical Scholarship, edited by Anne Kelly Knowles. The book addresses the growing field of combining Geographic Information System (GIS) software with historical scholarship. ((Technical aside: GIS is a broad term for digital analysis of geographic information – most commonly used for making maps – that allows users to input, store, and analyze a huge range of spatial data in a mind-boggling number of ways. Personal aside: I have a been using GIS software for about two years – I employed it extensively in my undergrad research and took a geology class constructed almost entirely around ArcGIS analysis.)) Broken into chapters comprised of individual studies conducted by a variety of scholars, it’s the more modern version of Knowles’s 2002 volume, Past Time, Past Place: GIS for History. The chapters of Placing History range from the quantitatively analytical “Scaling the Dust Bowl” and “Mapping Husbandry in Concord: GIS as a Tool for Environmental History,” to the more big-picture, theory-based “Combining Space and Time: New Potential for Temporal GIS.”

Originally I was planning on finishing all of the chapters before I posted a review of the volume as a whole, but I was too blown away by the introductory chapter of the book, “GIS and History,” written by Knowles. She gives both a wide-ranging and deep analysis of the field. Knowles begins the chapter with the optimistic assertion that, “scholars’ use of geographic information systems (GIS) is changing the practice of history.” From there she gives a brief history of the field, then delves into its current state. I think her greatest accomplishment in this chapter is to balance the obstacles to historical GIS with its huge potential for innovation and scholarship.

On the obstacle end, she writes that one major impediment to historical GIS is the fundamental divide of time vs. space – history is largely a study of subjects within a temporal framework, whereas GIS works largely within a spatial one. And she admits that, “For all practical purposes, historical GIS remains an ad hoc subfield that scholars discover serendipitously.” One reason may be a common complaint of historians concerning geography: that maps are too often seen as stand-alone, objective vessels of information. Instead, Knowles brings up the great point that any serious use of historical GIS requires rigorous examination and discovery of spatial source material, as much as any historian would need to employ in utilizing any diary, letter, or tax record for their research.

Nevertheless, Knowles does a great job of clearly outlining both the advances that have been made and the possibilities for the future. I agree with her basic outlines of the three types of historical GIS currently used:

1. History of land use and spatial economy, ex. outlining agricultural shifts in response to economic or environmental changes.

2. Reconstructing past landscapes, ex. analyzing Robert E. Lee’s line-of-sight (what he could see) during the Battle of Gettysburg.

3. Infrastructure projects, ex. scientists compiling historical landuse datasets in order to track global warming.

In actuality, though, it is nearly impossible to generalize the range of possibilities for historical GIS. The major constraint is really one of imagination and resources – are people aware of all its possibilities, and do they have access to the software/expertise. Finally, she struck a real personal chord in me with her observation that “The most exciting thing about historical GIS is often the ‘eureka’ moment when someone sees data mapped for the first time.” Much like discovering a long-sought after name or date or reference within a manuscript or microfilm, suddenly witnessing your hard work take a physical, visible shape on a computer screen is truly special.

I’m looking forward to reading the rest of the case studies and writing up a brief review, but for a superb introduction to the field of historical GIS, I couldn’t ask for anything better than what Knowles has produced in the opening chapter. At some point I would like to write a post solely dedicated to brainstorming ideas about the ways GIS could be utilized for history in particular and the humanities as a whole, in the vein of PhDinHistory’s blog post, “What I Would Like To See in Text Mining For Historians.”